
Data junkies like me know that data is going to be essential to both containing the spread of the novel coronavirus and to finding an eventual vaccine. While the world is working together to stop the spread, improve treatment outcomes, and protect the most vulnerable populations, data will serve many purposes. It will help leaders implement measures to slow the virus’ spread, it will help the public respond based on what we know makes a difference, and encourage us all to not give in to panic and fear. And that’s why Splunk is bringing data to this current crisis.
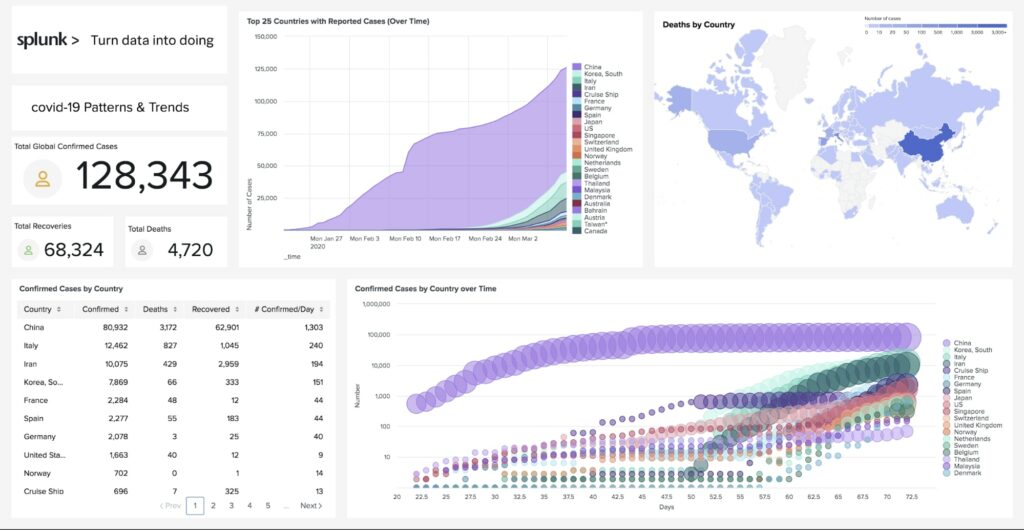
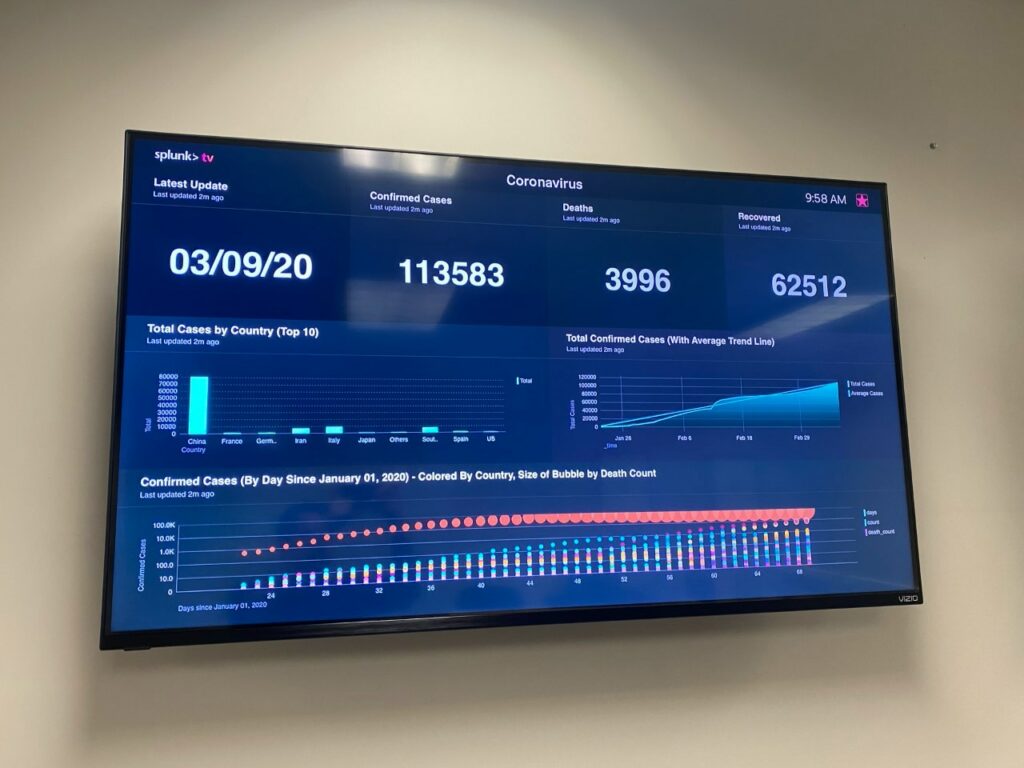
Splunk for Good, our social impact arm, has built a publicly available interactive Splunk COVID-19 Dashboard that any individual or organization can view without any installation necessary. We’ve also provided an application that an individual or organization can download, populate with their own data, and use it to help get a better understanding of the data behind the pandemic. How can you get started? Download the app from Github and add your own visualizations or data that you think might be interesting.
While we will continue to expand our app and add features, we understand that others have their own ideas of how to visualize this data. Feel free to clone this app and create your own version, or get in touch with us at splunkforgood@splunk.com to collaborate and submit data and visualizations that you think others may find useful in the publicly available app.
Our goal with the Splunk COVID-19 Dashboard is to help leaders bring data to every potential response to best ensure public safety. Already, we’ve seen community-driven work from the likes of Prudential, Herc Rentals, Accenture, and our own Global Security team. With this public resource, we hope to see other partners emerge to develop additional interactive dashboards that will help analyze the data behind this coronavirus, contribute subject matter expertise on infectious diseases, and bring forward additional interesting research, ideas, and suggestions.
For example, a Splunk champion at the UK’s National Health Service built this dashboard to pull in UK information. This now makes it possible to track cases at a local level that help organizations understand data trends in a very granular way. This was done as a personal project by a curious technologist who wanted to understand how data can help us see COVID-19 differently.
Our response to the COVID-19 situation mirrors similar work from Splunk through the years. We’ve worked with a variety of partners to help in times of disaster. We partnered with the University of Illinois to help contain a severe strain of flu among their athletes. We collaborate closely with NetHope to combat and address humanitarian crises around the globe, from those impacted by political crises in Syria, to families displaced by megastorms in Puerto Rico and the Bahamas. And we work with NewYork-Presbyterian Hospital to fight the opioid epidemic by helping to more closely safeguard controlled substances and guard against the illegal distribution of those medications.
There is no doubt that we are facing increasingly challenging issues that are affecting billions of people in a variety of ways. Our optimism is tested when our daily lives are disrupted, we’re worried about the health of our families and communities, and global markets are in turmoil. But that is exactly when we’re called on to be our best, and when data can play its most meaningful role.
I am confident that as we make progress to combat this crisis and marshal the appropriate resources, we will contain this outbreak and build even more resilient systems for the future. And essential to that quest will be data. In the face of fear and concern, I remain positive about the power of data to help shape a better world.
Sign up to receive the latest information from VNCS

© 2022 Vietnam Cyberspace Security Technology. All Rights Reserved
